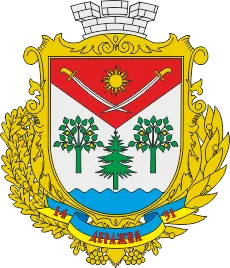
Деражнянська міська територіальна громада
Живописною природою, багатовіковою історією, працьовитими й талановитими людьми відома земля Деражнянської громади. Ми маємо унікальне географічне положення, вагомий сільськогосподарський та трудовий потенціал, багату культурну та історичну спадщину. Все це формує інвестиційний потенціал Деражнянської міської територіальної громади – громади, що прагне розвиватися, ставати кращою, громади, яка націлена на постійну співпрацю з інвесторами та готова до створення нових робочих місць для покращення добробуту кожного громадянина. Ми впевнені, що в нашому краї Ви знайдете багато друзів та надійних партнерів для бізнесу. Спільними зусиллями ми зможемо отримати вагомі результати у майбутньому для економічного зростання та благополуччя громади. Чекаємо на Вас та більш детально представимо весь потенціал Деражнянської міської територіальної громади.
Очолює Деражнянщину міський голова – Андрій Миколайович Ковпак. Обраний на місцевих виборах 25.10.2020 року.
Euro-integration community index
What does this indicator show? An integral indicator reflecting the community's readiness for European integration processes.Calculated as a weighted average of scores across six areas:
• Institutional capacity;
• Strategic planning;
• Financial capacity;
• Development project portfolio;
• Monitoring and reporting;
• Transparency and access to information.
Scale — from 0 to 100 points:
🔴 0–29.9 — critical;
🟠 30–59.9 — risk;
🟡 60–84.9 — in progress;
🟢 85–100 — done.
The indicator is updated quarterly, and the value below the index shows the change compared to the previous quarter.
64/ 100
Development project portfolio
What does this indicator show? The indicator shows the number of the community's active projects and their level of readiness for implementation.It also shows the share of projects that have:
• approved design and cost estimate documentation;
• the necessary approvals and documents;
• readiness for submission for funding or for the start of implementation.
This helps assess the community's project potential and readiness to attract investment.
4active projects in the community
projects have ready design & estimate docs
Attracted funding volume
What does this indicator show? Shows the total amount of funds attracted by the community over the selected period.The indicator may include:
• international grants;
• state funding;
• local budget funds;
• private investment;
• other off-budget sources.
The donut chart shows the share of off-budget funding in the total amount of funds attracted.
19.3mlntotal volume in 2026
off-budget funds
Community internal balance
What does the chart show? The chart shows the community's current development across these areas:• Strategic planning;
• Digitalisation and data;
• Public investment;
• Partnership;
• Administrative capacity;
• Monitoring and evaluation;
• Financial management;
• Procurement and environment;
• Integrity;
• Financial capacity;
• Cooperation.
Each indicator is scored from 0 to 100:
🔴 0–29.9 — critical;
🟠 30–59.9 — risk;
🟡 60–84.9 — in progress;
🟢 85–100 — done.
The higher the score, the stronger the community's capacity in that area.
- 0–29.9 — critical
- 30–59.9 — risk
- 60–84.9 — in progress
- 85–100 — done
Community EU-integration index dynamics
What does this chart show? The chart shows how this community's EU-integration index changed over time.Each point is the value at the end of the corresponding period.
Month — last 12 months, Year — last 5 years.
The index is measured on a 0 to 100 scale.
No data for this period yet